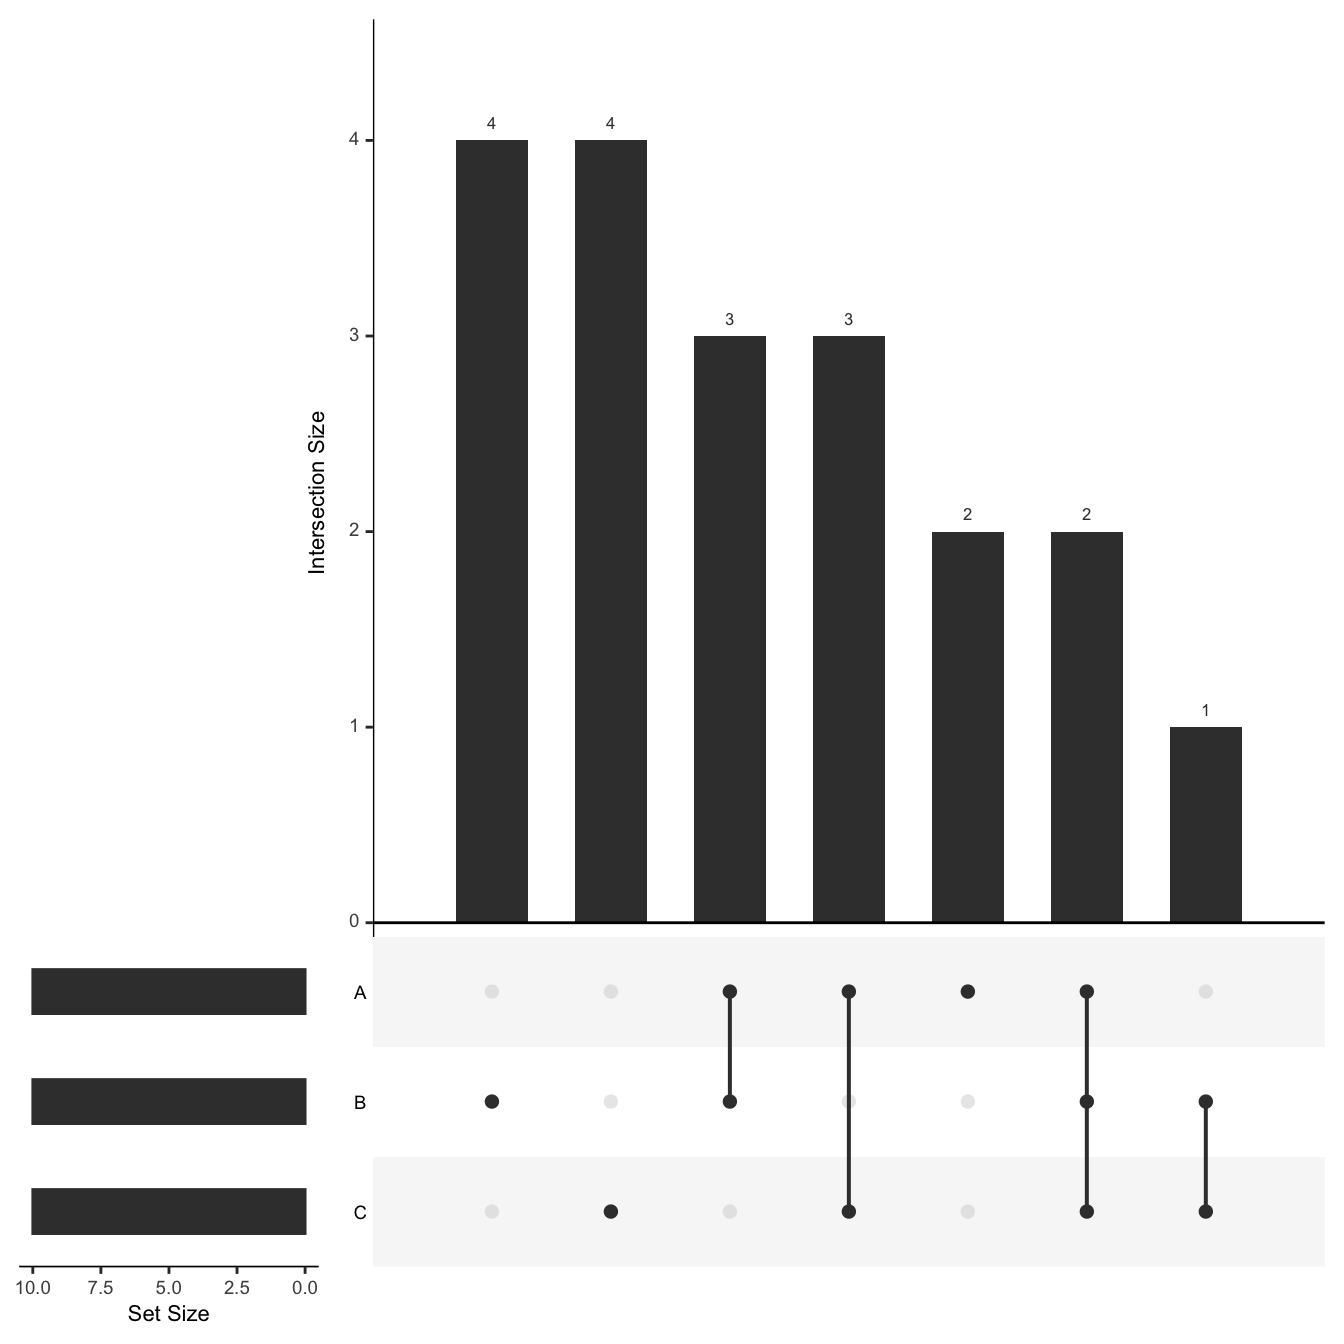
        A       B       C
1   apple  banana    kiwi
2  banana    date     fig
3  cherry    kiwi   lemon
4    date  orange   mango
5    kiwi    pear   berry
6  orange     fig    pear
7    pear   grape coconut
8    plum   melon   guava
9   mango   peach  papaya
10 papaya apricot plumBlock 1
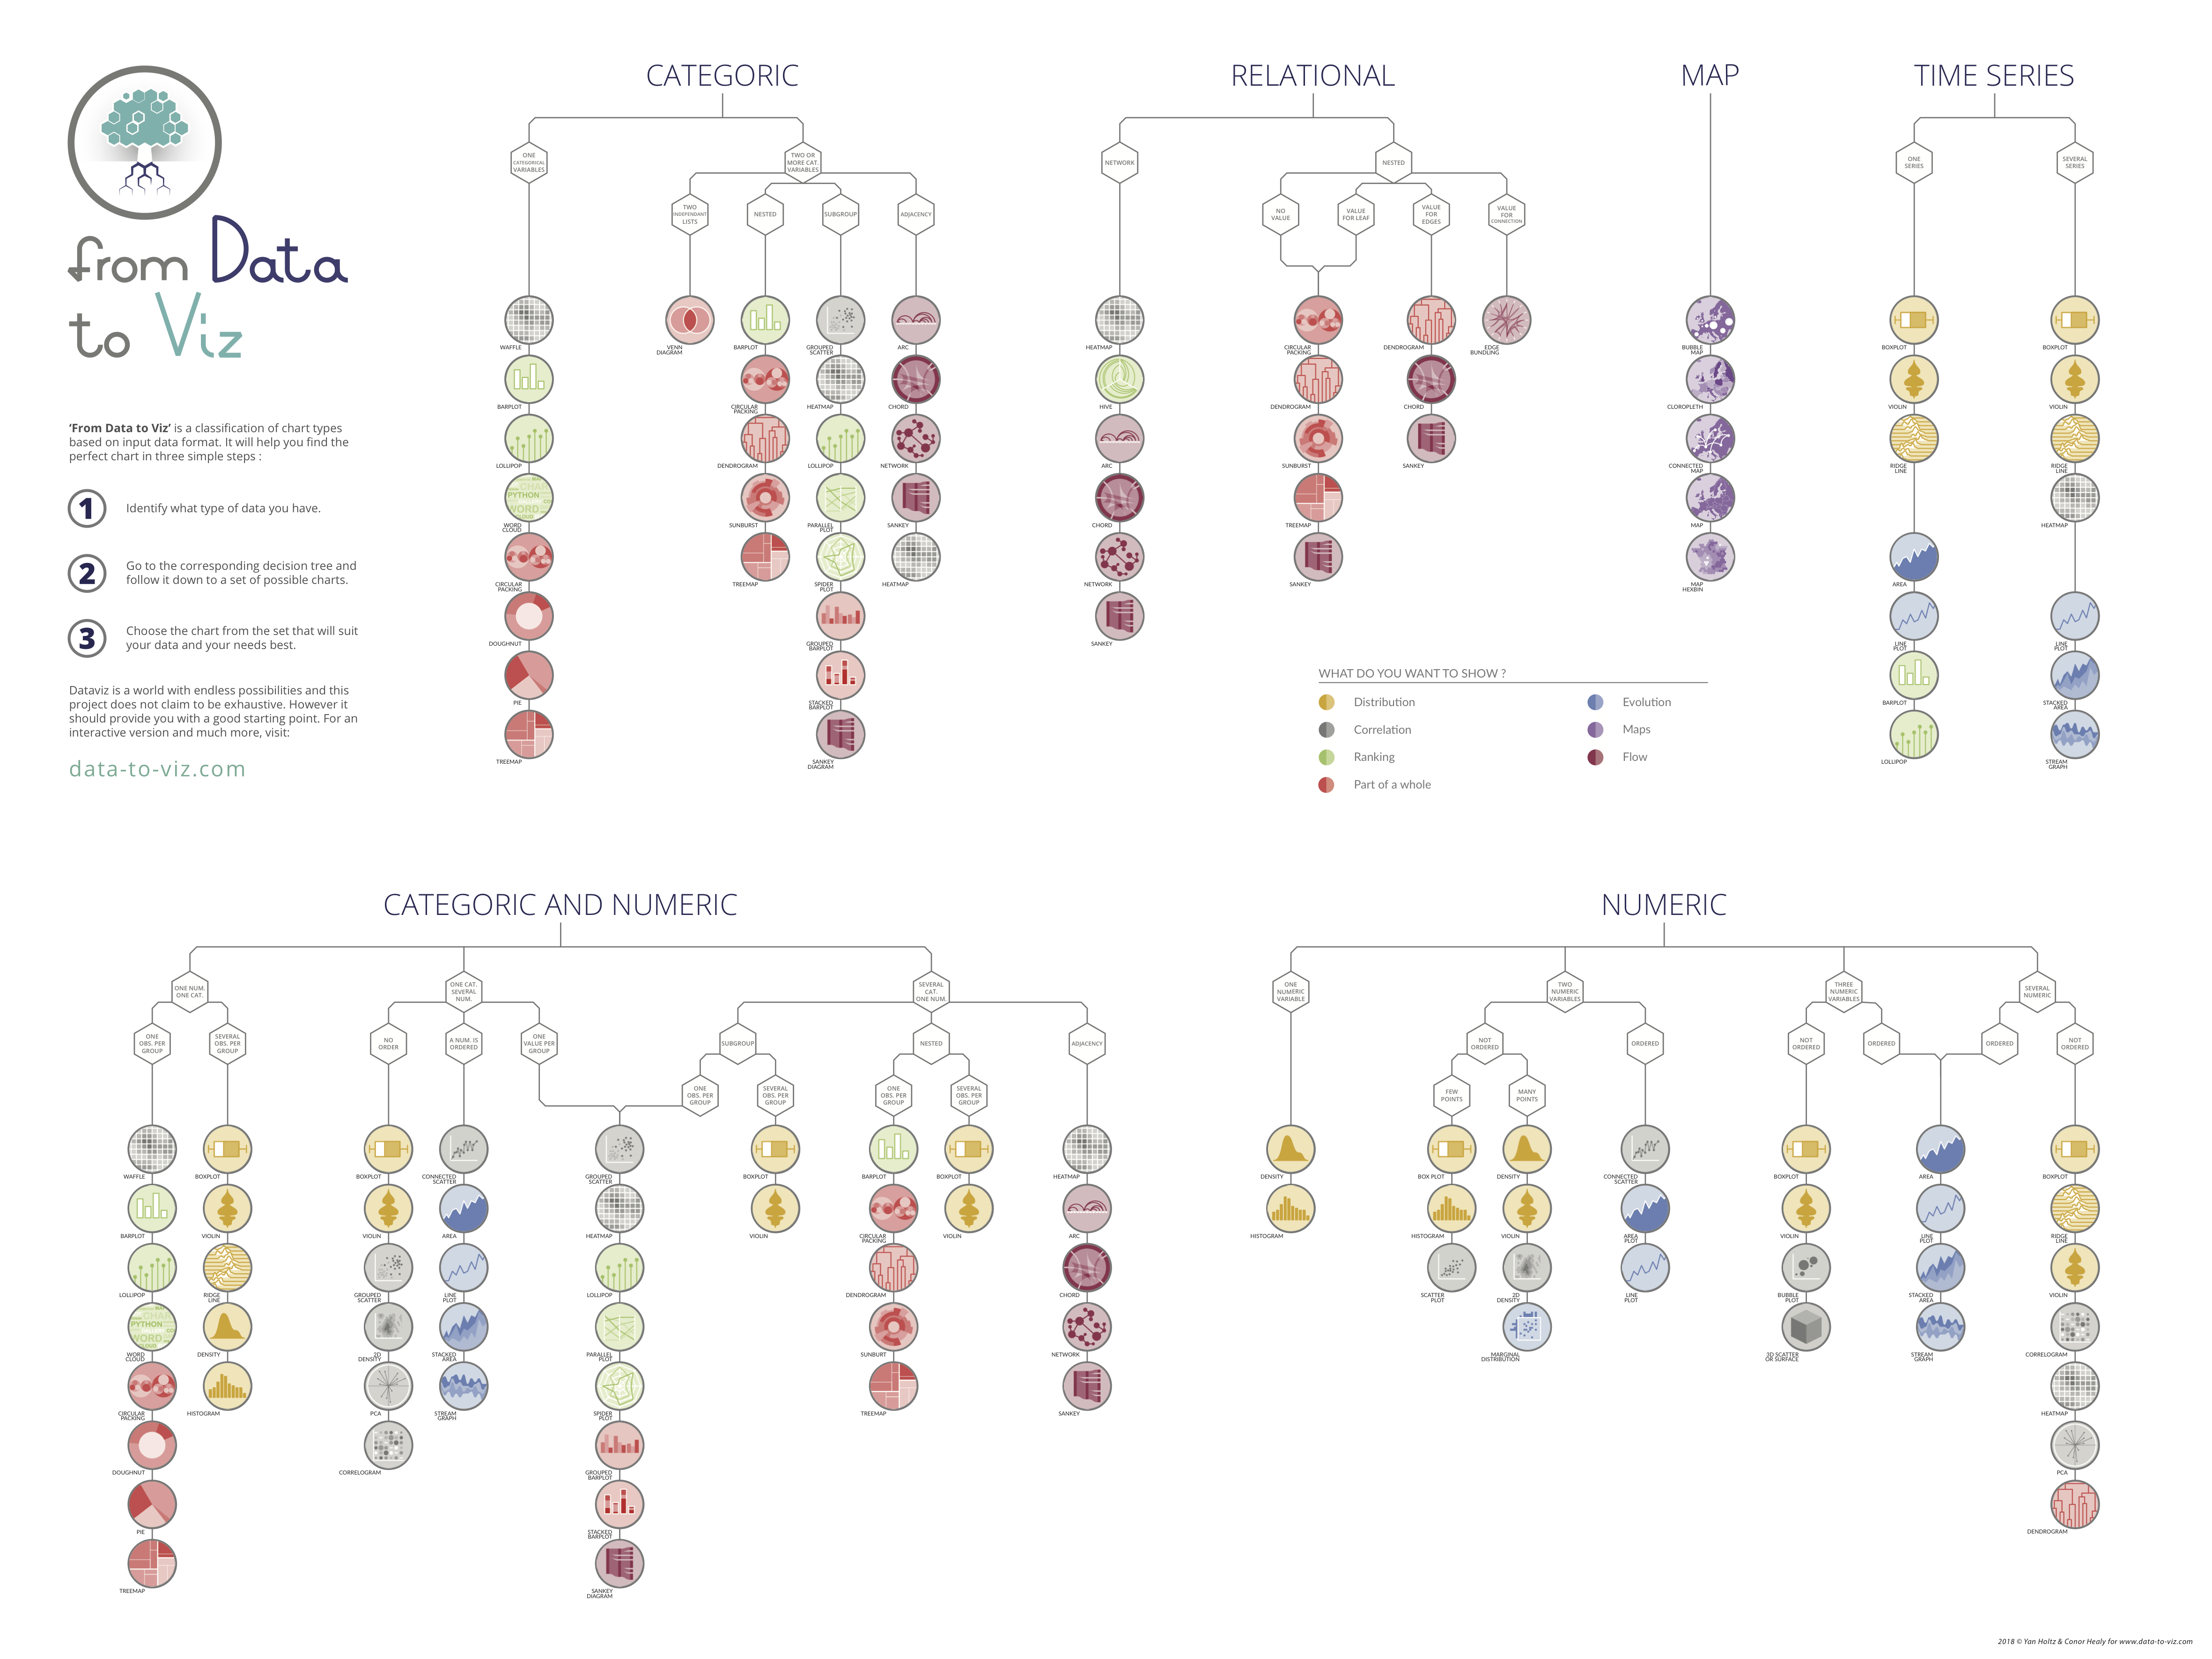
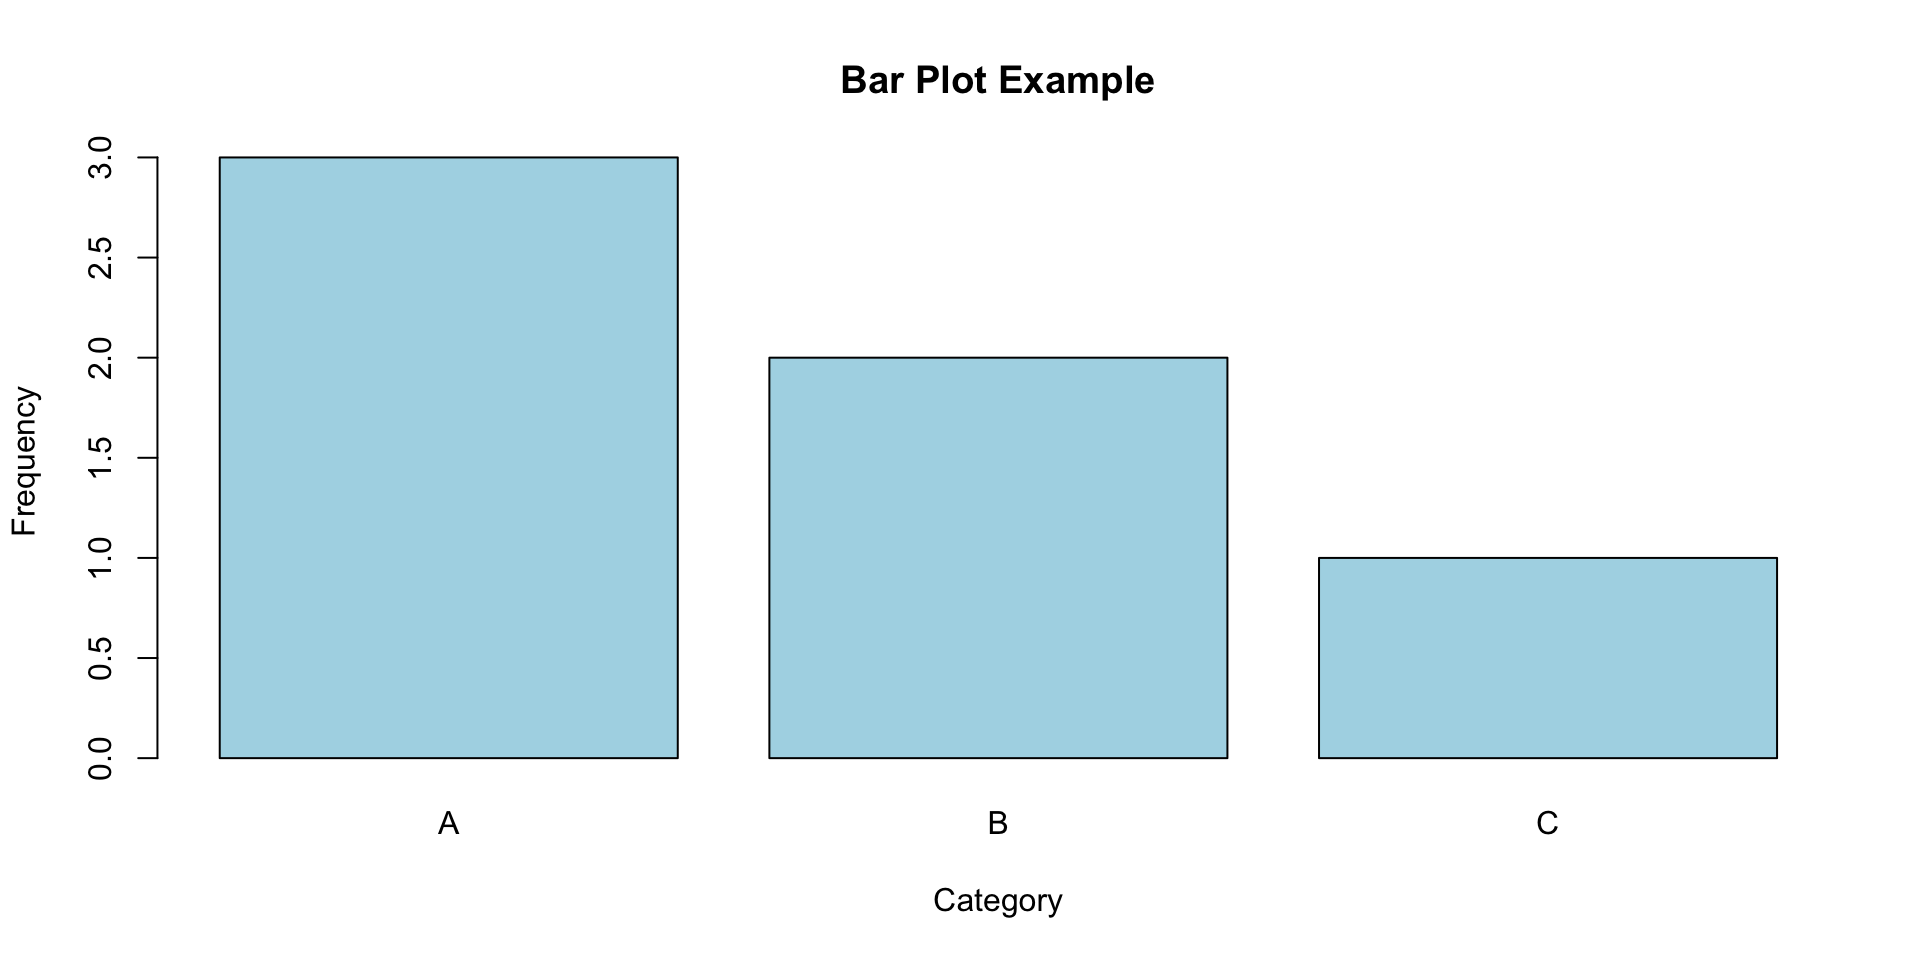
Categorical Data
- Use bar charts to compare categories
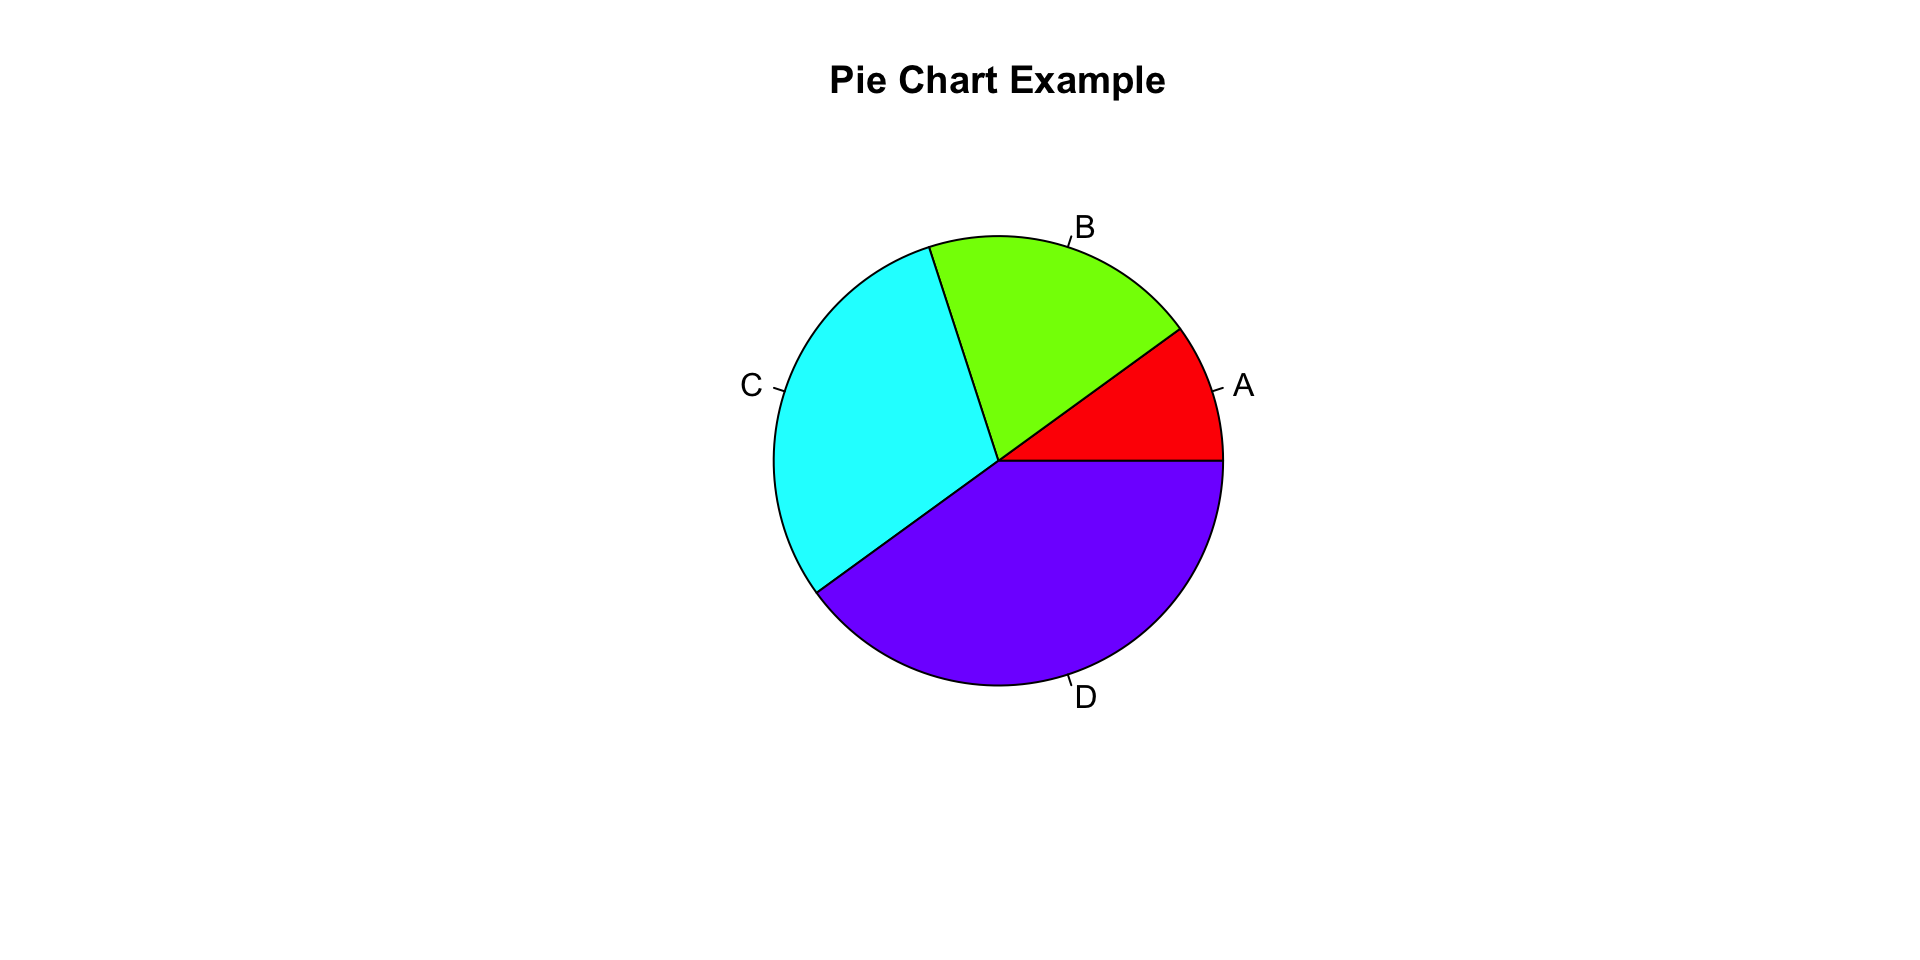
Categorical Data
- Use pie charts to show proportions
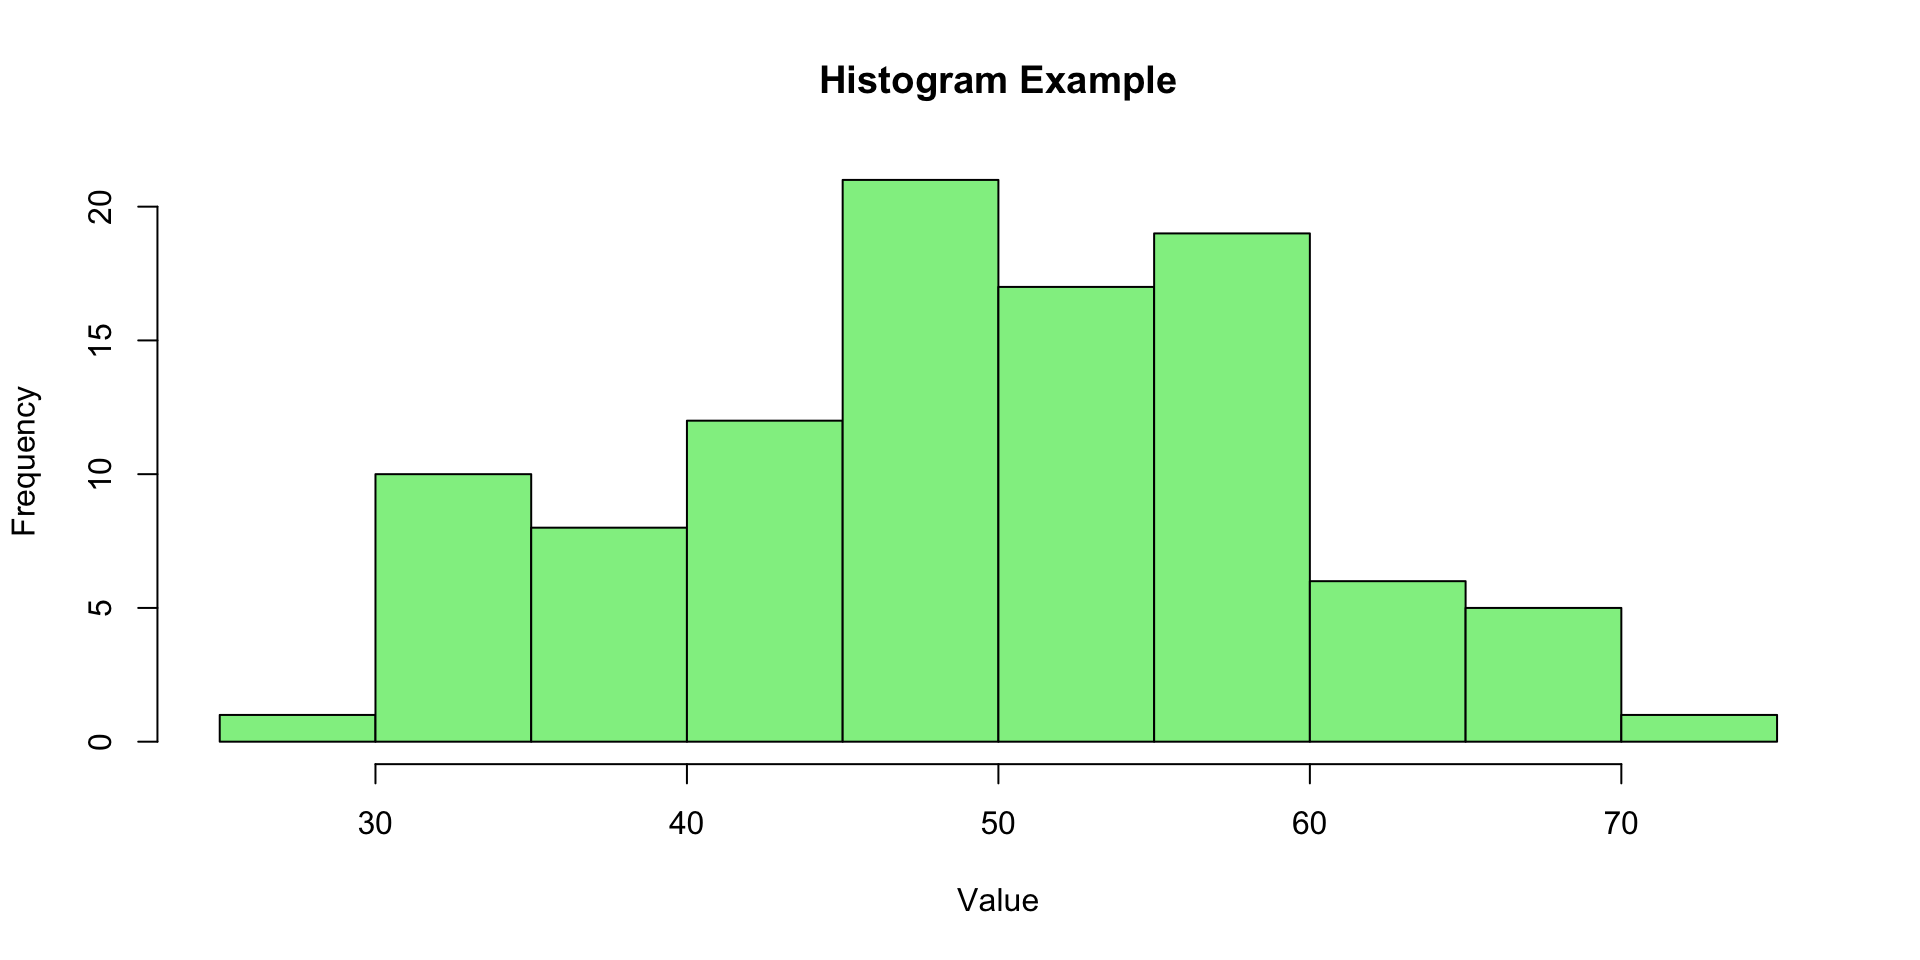
Numeric Data
- Use histograms to show distributions
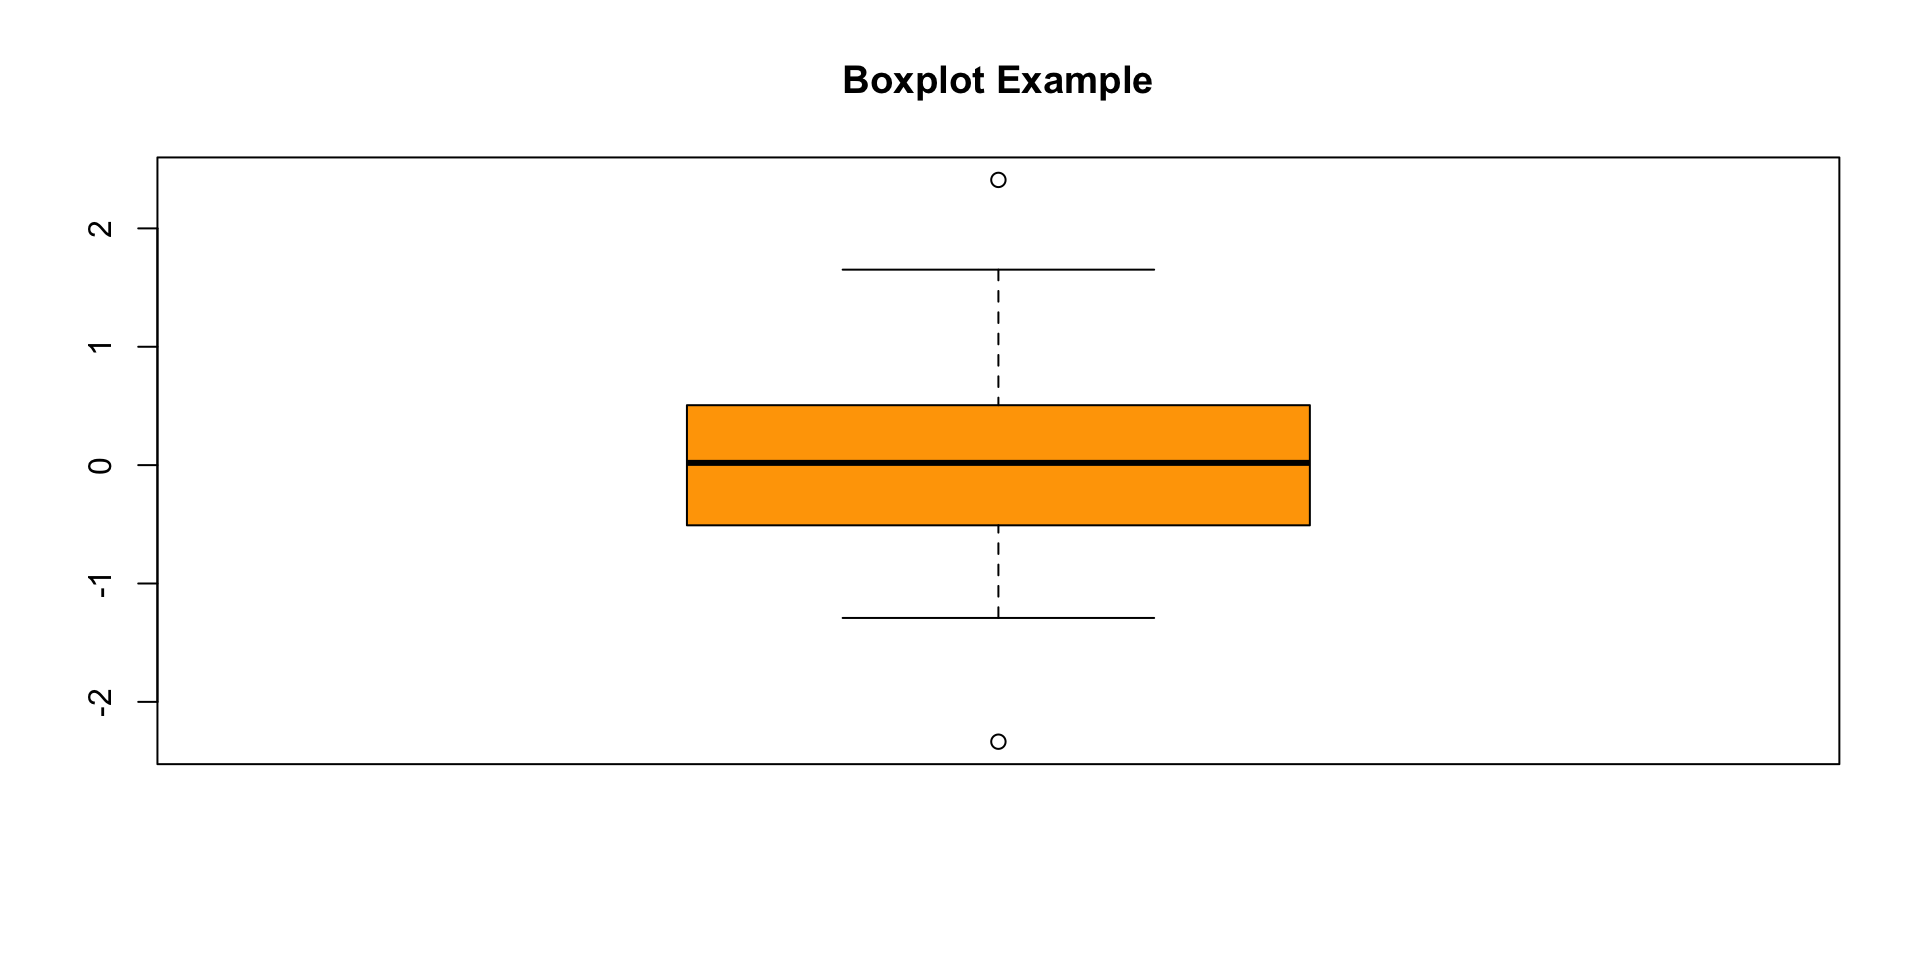
Numeric Data
- Use boxplots to show spread and outliers
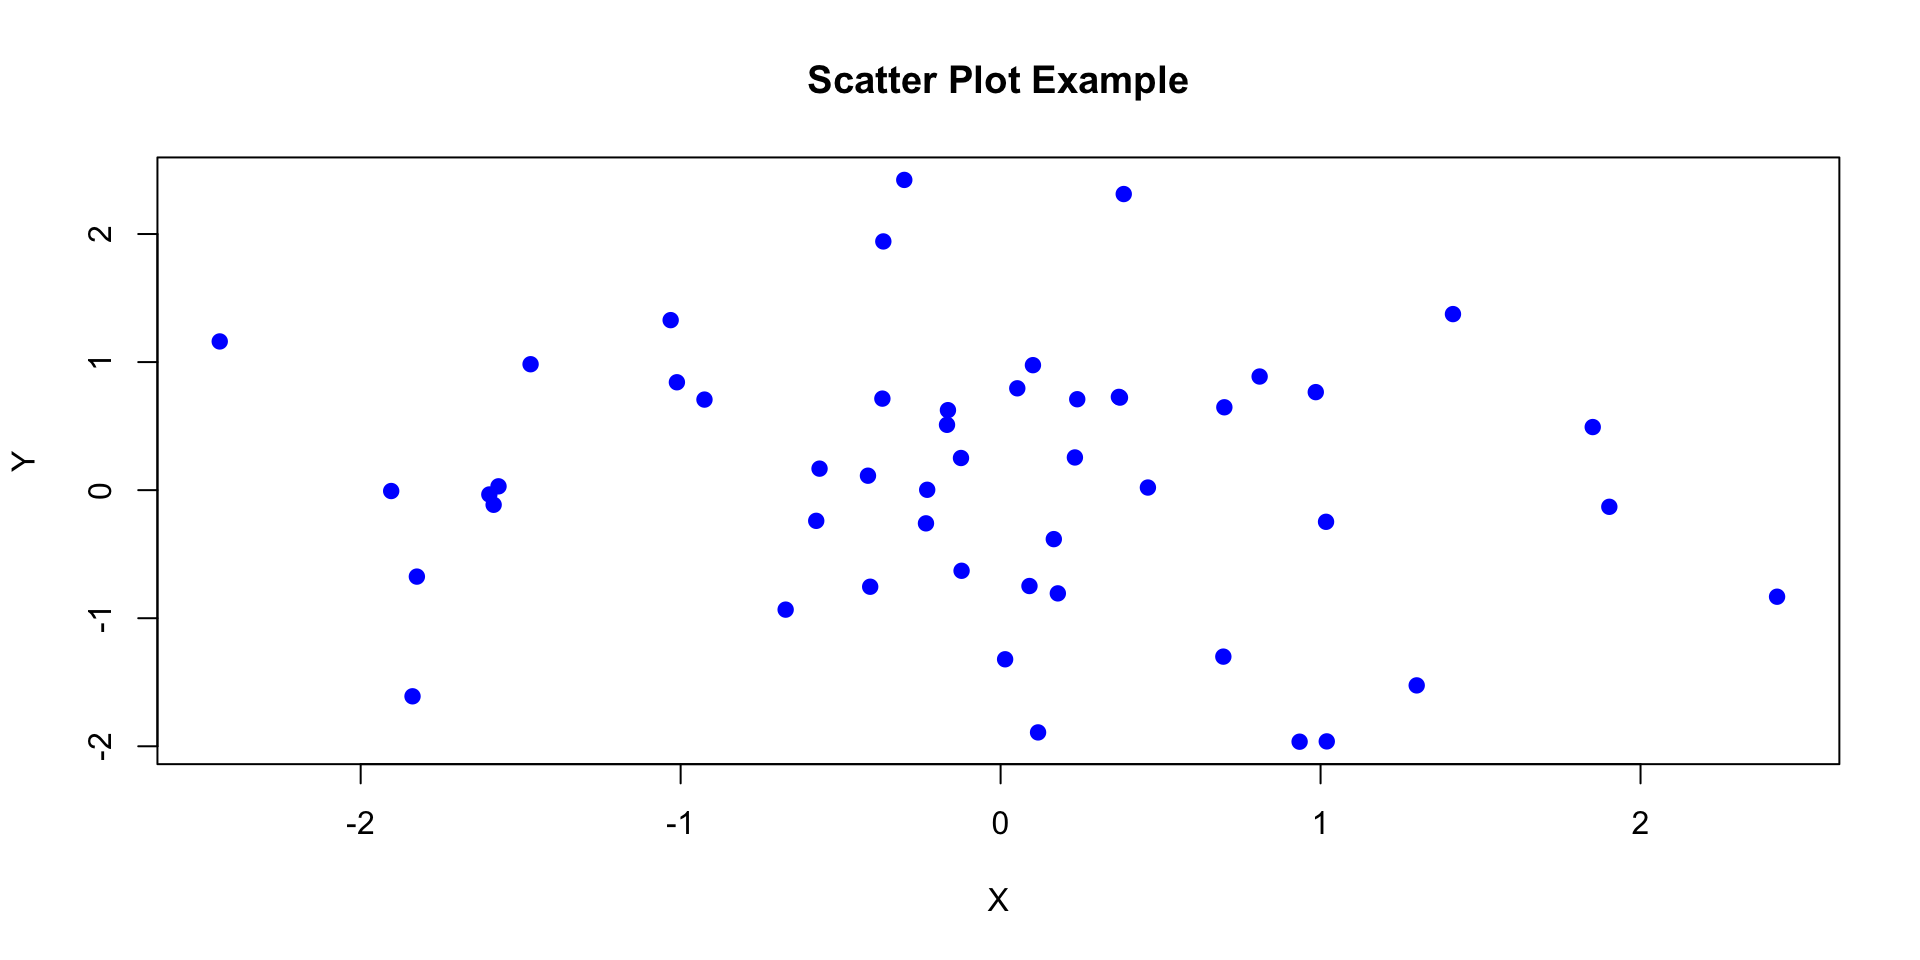
Relational Data
- Use scatter plots to show relationships between two numeric variables
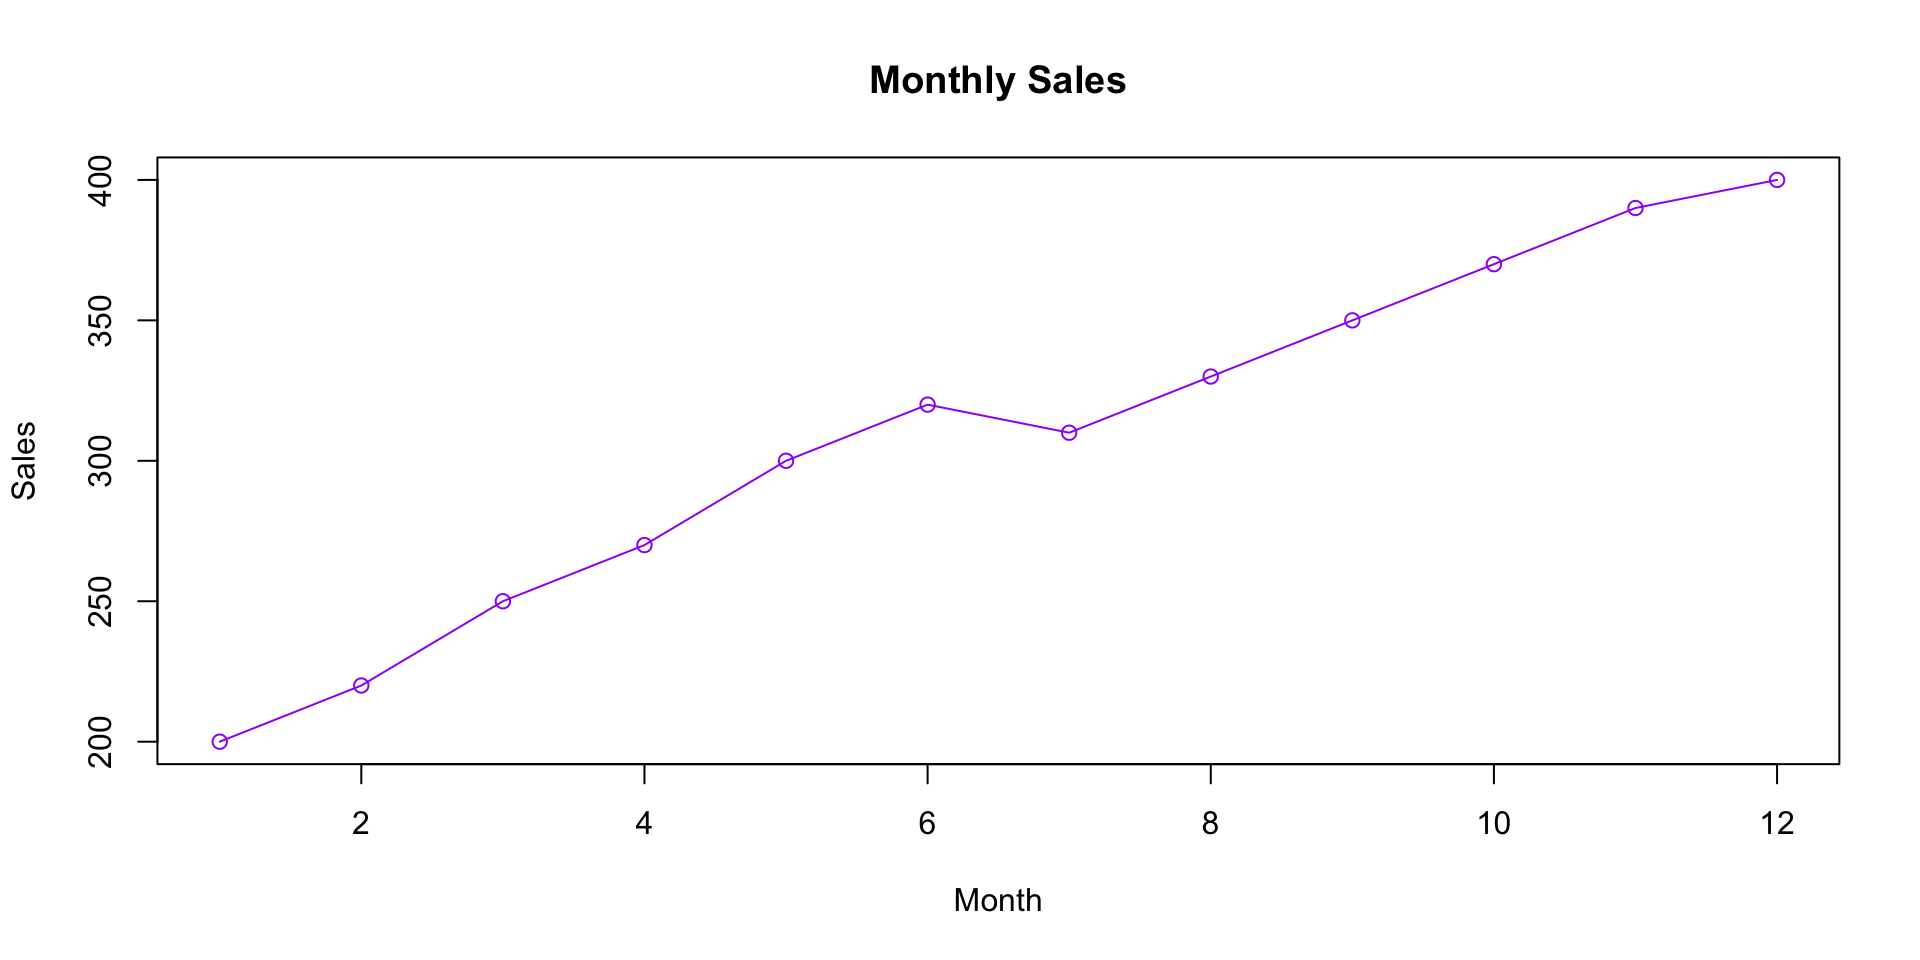
Time Series Data
- Use line charts to show trends over time
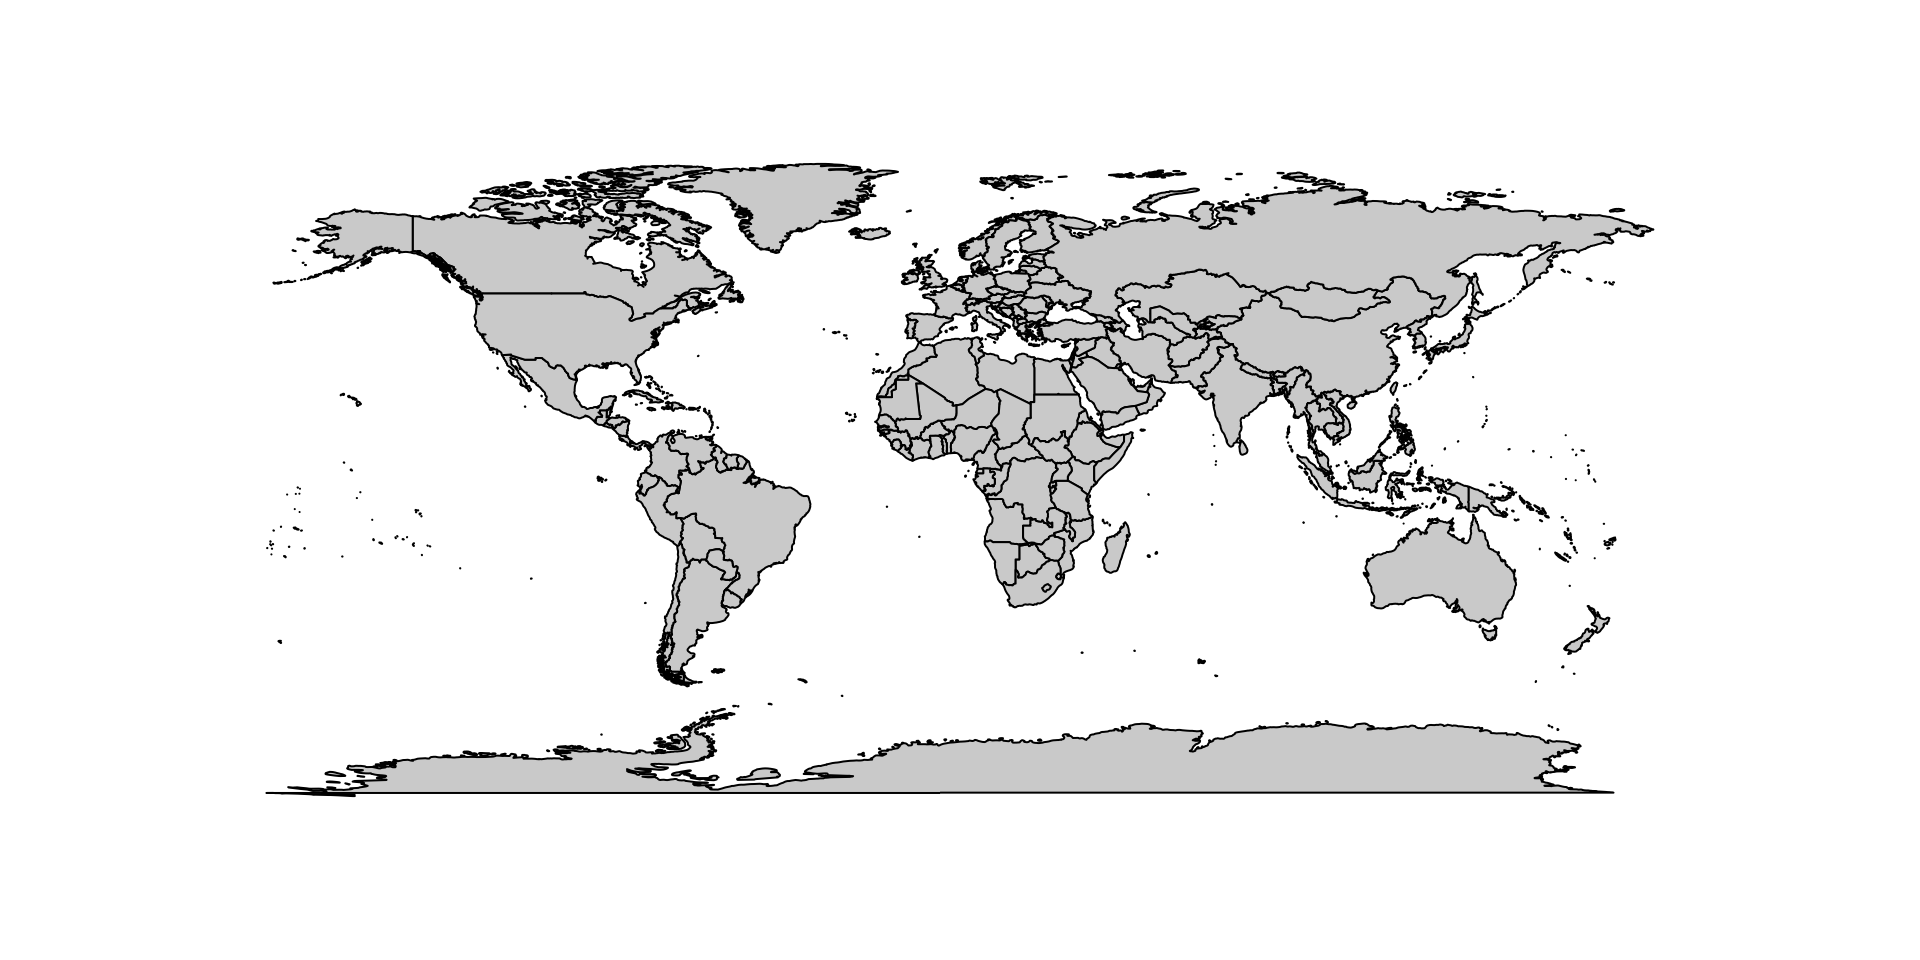
Geographic Data
- Use choropleth maps to show values by region
        A       B       C
1   apple  banana    kiwi
2  banana    date     fig
3  cherry    kiwi   lemon
4    date  orange   mango
5    kiwi    pear   berry
6  orange     fig    pear
7    pear   grape coconut
8    plum   melon   guava
9   mango   peach  papaya
10 papaya apricot    plum
        A       B       C
1   apple  banana    kiwi
2  banana    date     fig
3  cherry    kiwi   lemon
4    date  orange   mango
5    kiwi    pear   berry
6  orange     fig    pear
7    pear   grape coconut
8    plum   melon   guava
9   mango   peach  papaya
10 papaya apricot    plum